Chris Falk banner image

2016 EOY Office Market Synopsis

January 13, 2017
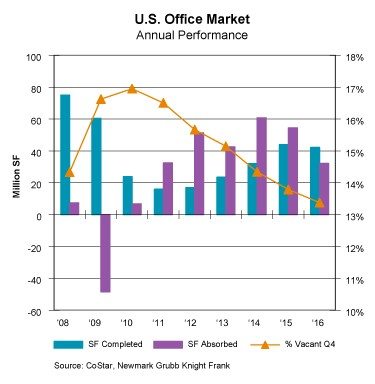
The U.S. office market tightened in 2016 for a sixth consecutive year, although it showed signs of reaching equilibrium as vacancy stabilized in the fourth quarter and deliveries exceeded absorption by a wide margin. Here are the key points:

  • Tenants absorbed 32.2 million square feet in 2016, down for a second consecutive year from the cyclical peak of 60.8 million square feet in 2014. Absorption followed the same trajectory as payroll job growth, which peaked in 2014 at 3.0 million and then receded to 2.7 million in 2015 and 2.2 million in 2016.
  • Absorption last year was strongest in Seattle at 3.5 million square feet and Dallas at 2.2 million square feet, with Los Angeles, Phoenix and Salt Lake City rounding out the top five markets. A different set of markets led in fourth-quarter demand, with Boston, Nashville and St. Louis all absorbing just over 1.0 million square feet.

  • Deliveries of new buildings added 42.2 million square feet to the market last year, down slightly from the pace of deliveries in 2015. But absorption declined even more, falling behind deliveries for the first time since 2010.
  • Space under construction ended 2016 at 90.1 million square feet, largely unchanged during the course of the year. The plateau in construction activity suggests that tighter bank lending standards for construction loans are having an impact, and that deliveries are set to plateau as well.
  • Vacancy ended 2016 at 13.4%, unchanged from the third quarter and down from 13.8% a year ago. The hot Nashville market, at 5.3%, beat out some of the usual suspects including San Francisco, Manhattan, Austin and Seattle, all of which reported sub-10% vacancies. Salt Lake City, Raleigh-Durham and Orlando—high-growth midsized markets—also ended the year in the single digits.
  • The supply of available sublease space ended 2016 at 92.9 million square feet, not far from where it started the year at 89.7 million square feet. The plateauing in sublease space is another sign of a market in equilibrium.
  • The average asking rent across the U.S. ended 2016 at $29.98/SF full service, up 0.8% from the third quarter and 3.2% from a year ago. The modest increase in rents is yet another sign of equilibrium. Three markets posted double-digit rent gains last year: Oakland/East Bay, Nashville and Portland.

Outlook

Several of the programs touted by the incoming Trump administration—tax cuts, infrastructure spending and lighter regulatory burdens—could stimulate business capex and thereby prolong the economic expansion, which, at 91 months, is already one of the longest since World War II. Nevertheless, with the labor market near full employment, these programs are unlikely to have much effect on the modest pace of hiring. Expect absorption and deliveries of new office space to balance each other out in 2017 and 2018. New buildings will lease up, as will second-generation space left behind by relocating tenants, but at a slower pace. The U.S. vacancy rate is on track to rise by 10 basis points in 2017 and then level out in 2018. Asking rents should continue to rise at a modest pace in the low single digits over the next two years, pushed higher by premium rates in newly delivered projects. Tenant concessions packages are likely to become more generous for available second-generation space.

About the Author

Chris Falk SIOR, CCIM

Chris Falk is a Certified Commercial Investment Member (CCIM)—one of the most comprehensive commercial real estate designations, held by an estimated 6% of commercial brokers nationally. As a commercial real estate broker, Chris has handled over 600 transactions exceeding $475MM. Born and raised in Utah, Chris understands the unique qualities of the region and the great capacity for business opportunities in Northern Utah, including Davis, Weber and Salt Lake Counties. Chris is the premier, go-to agent for businesses and developers interested in this dynamic area.