
Categories
It’s a truism in the real estate world that job growth leads demand for space, as measured by leasing activity and absorption. This raises the question of what indicator leads job growth, and the answer is corporate profits. If a company isn’t profitable, it’s less likely to add staff except under special circumstances, for example, if it’s getting early-stage funding from a venture capital firm.
The U.S. Bureau of Economic Analysis measures corporate profits in the National Income and Product Accounts (NIPA), from which GDP is derived. Although profits are reported even later than GDP—which limits their usefulness as a leading indicator—a similar concept, S&P 500 earnings, is reported in real time during earnings season. NIPA profits and S&P earnings are measured differently and can vary from quarter to quarter, but they address the same question—how much money a company is making, and by extension, how much dry powder it has on hand to add staff.
As the below graph shows, the corporate profits cycle can turn ahead of the labor market cycle by several quarters and even years. Profits peaked in the third quarter of 1997, but the wave of capital flowing into the dot-com sector kept the economy afloat for three more years. Profits were at their nadir in the third quarter of 2001, a few months before the 2001 recession ended and well ahead of the labor market, which didn’t bottom out until the second quarter of 2003.
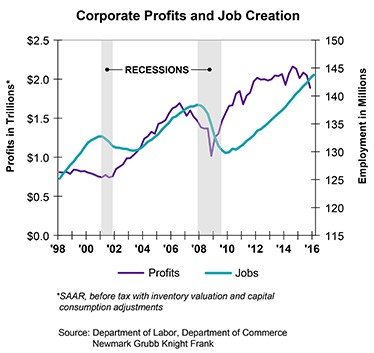
| Leading up to the 2007-2009 recession, profits peaked in the third quarter of 2006, five quarters before the labor market and economy turned. Profits bottomed in the fourth quarter of 2008, two quarters before the recession ended and four quarters before the labor market bottomed.
More recently, profits peaked in the third quarter of 2014, and seven quarters later, the labor market continues to grow at a solid pace. Although first-quarter NIPA profits won’t be released until late May, earnings for the S&P 500 are almost complete. According to FactSet, as of May 6, the first-quarter earnings of the S&P 500 were down 7.1% year-over-year, based on a blend of actual results from 87% of companies reporting and projected results for the 13% of companies not yet reporting. Seven sectors reported year-over-year decreases, led by a plunge of 107.2% (negative earnings) in the energy sector. Three sectors reported increases, topped by a 19.1% gain in the consumer discretionary sector, where profits were strongest in the online sales and automobile sub-sectors. Some key points relevant to commercial real estate:
|

Chris Falk is a Certified Commercial Investment Member (CCIM)—one of the most comprehensive commercial real estate designations, held by an estimated 6% of commercial brokers nationally. As a commercial real estate broker, Chris has handled over 600 transactions exceeding $475MM. Born and raised in Utah, Chris understands the unique qualities of the region and the great capacity for business opportunities in Northern Utah, including Davis, Weber and Salt Lake Counties. Chris is the premier, go-to agent for businesses and developers interested in this dynamic area.


